 Geobru catalogue
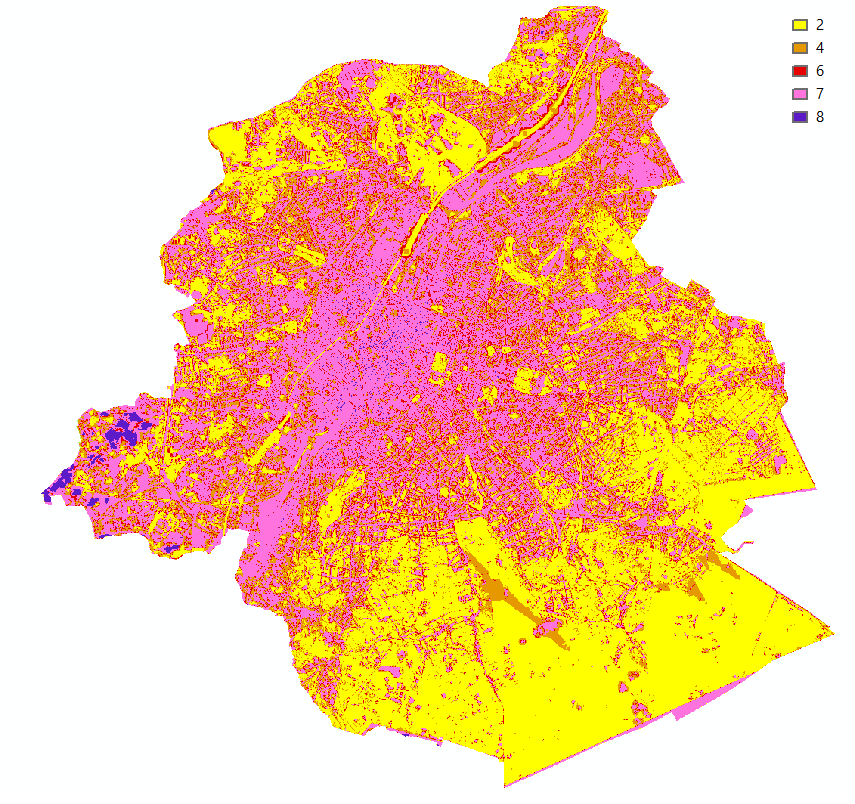
noise disturbance
Type of resources
Available actions
Topics
INSPIRE themes
Keywords
Contact for the resource
Provided by
Formats
Representation types
Update frequencies
Scale
-
Brussels-Capital Region: location of the three areas of limitation of aircraft noise defined by the order of the Government of the Brussels-Capital Region of 27 May 1999 on the fight against the noise generated by air traffic. Note : http://geoportal.ibgebim.be/pdf/metadata_doc/19990527_agb_LutteBruit_TraficAerien.pdf
-
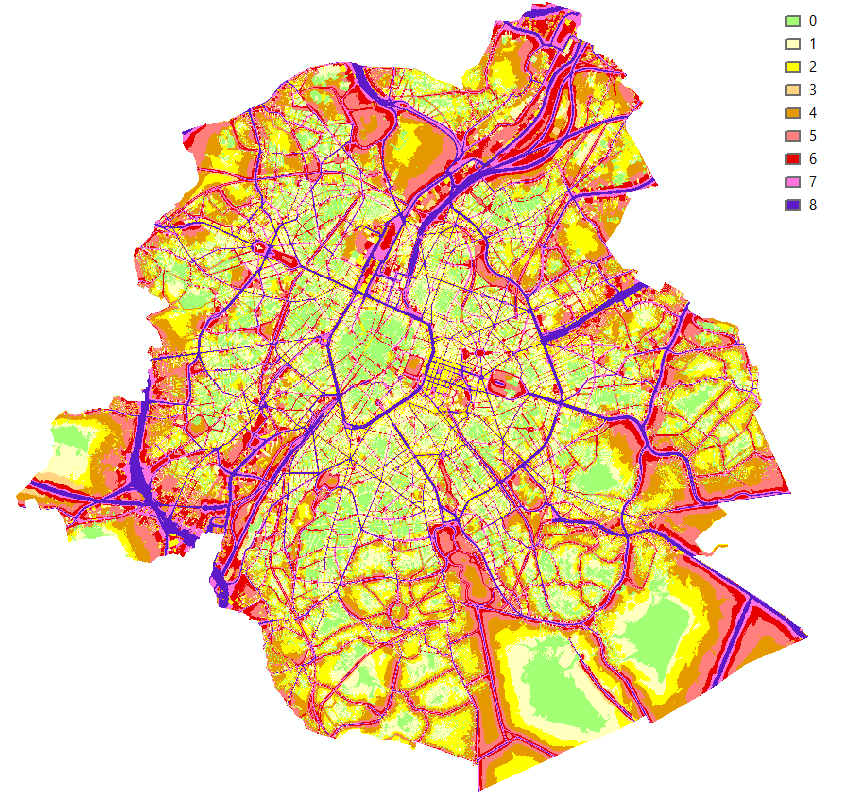
Brussels-Capital Region : This map shows the Health Impact Screening score for noise pollution (0-8) in the Brussels Capital Region. It was produced as part of the 2020 study on the "Impact of 'Nature-Based Solutions' (NBS) on urban residents' exposure to air pollution, noise pollution or high temperatures - Overview of general knowledge and recommendations for the Brussels-Capital Region". This map is based on the 2016 noise pollution maps for road traffic and rail traffic. For the methodology used, see p.51. The study report (in dutch) is available at http://document.environnement.brussels/opac_css/elecfile/NatureBasedSolutions
-
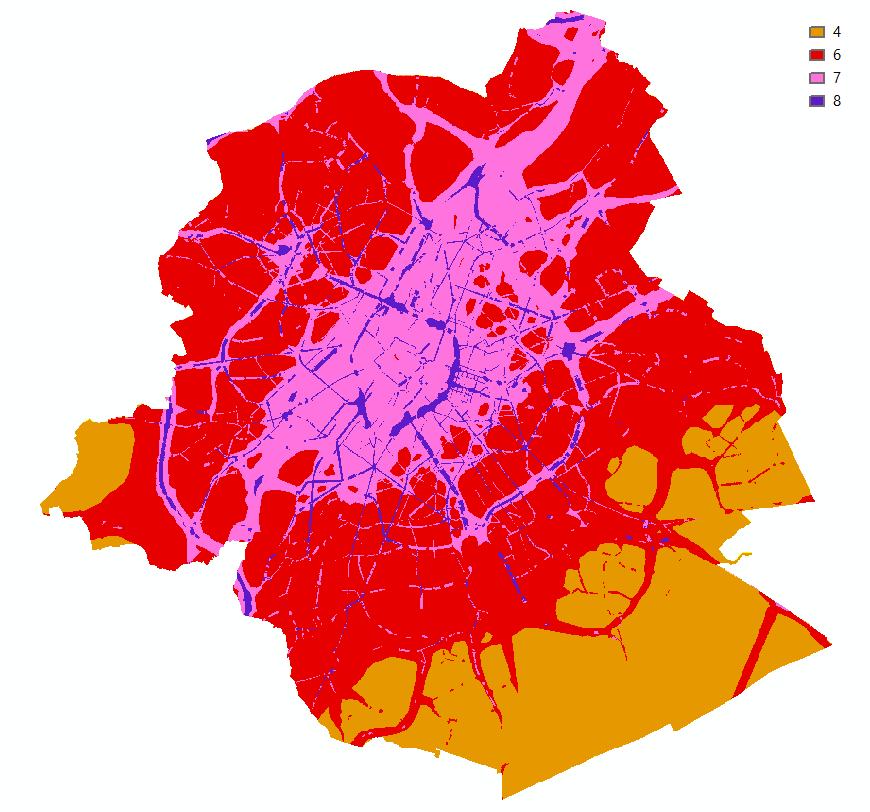
Brussels-Capital Region : This map shows the Health Impact Screening score for air quality (0-8) in the Brussels Capital Region. It was produced as part of the 2020 study on the "Impact of 'Nature-Based Solutions' (NBS) on urban residents' exposure to air pollution, noise pollution or high temperatures - Overview of general knowledge and recommendations for the Brussels-Capital Region". This map is based on the 2018 annual average nitrogen dioxide concentration map. For the methodology used, see p.49. The study report (in dutch) is available at http://document.environnement.brussels/opac_css/elecfile/NatureBasedSolutions
-
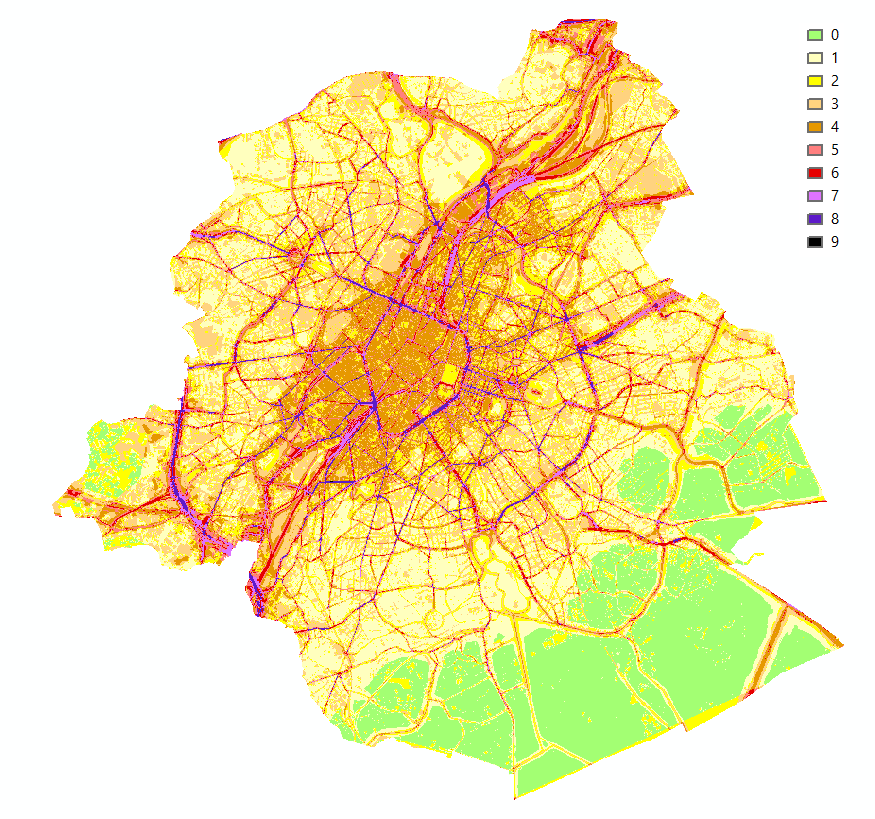
Brussels-Capital Region : This map shows the combined Health Impact Screening score for heat stress, air pollution and noise pollution (0-9) in the Brussels Capital Region. It was produced as part of the 2020 study on the "Impact of 'Nature-Based Solutions' (NBS) on urban residents' exposure to air pollution, noise pollution or high temperatures - Overview of general knowledge and recommendations for the Brussels-Capital Region". This map is a combination of 3 maps: heat stress (24/08/2016), air pollution (2018) and noise pollution (2016). For the methodology used, see p.54. The study report (in dutch) is available at http://document.environnement.brussels/opac_css/elecfile/NatureBasedSolutions
-
Brussels-Capital Region : This map shows the Health Impact Screening score for heat stress (0-8) in the Brussels Capital Region. It was produced as part of the 2020 study on the "Impact of 'Nature-Based Solutions' (NBS) on urban residents' exposure to air pollution, noise pollution or high temperatures - Overview of general knowledge and recommendations for the Brussels-Capital Region". This map is based on the maximum Wet Bulb Globe Temperature (WBGT) map of 24 August 2016. For the methodology used, see p.48. The study report (in dutch) is available at http://document.environnement.brussels/opac_css/elecfile/NatureBasedSolutions